- Features
- Tools
QI tools are seamlessly integrated, providing an easy to use platform, tailored to running QI projects.
- Community
Bring your people together to share ideas, accelerate learning and drive change - anytime, anywhere.
- Reporting
Track outcomes and analyze progress across your team, organization and beyond with secure analytics tools.
- Tools
- Use Cases
- Organisation Portfolio
Achieve and sustain better outcomes through purpose built QI tools, accurate data and a culture of sharing.
- Collaborative Programme
Remove the distance, bring your teams expertise together and turn great ideas into meaningful improvement.
- Building Capability
Place QI training and the developing of QI skills at the center of your organization's framework.
- Organisation Portfolio
- Pricing
- Resources
Driver Diagrams to visualise how your aim will be achieved
Translate your high level improvement aim into a logical set of underpinning drivers and changes
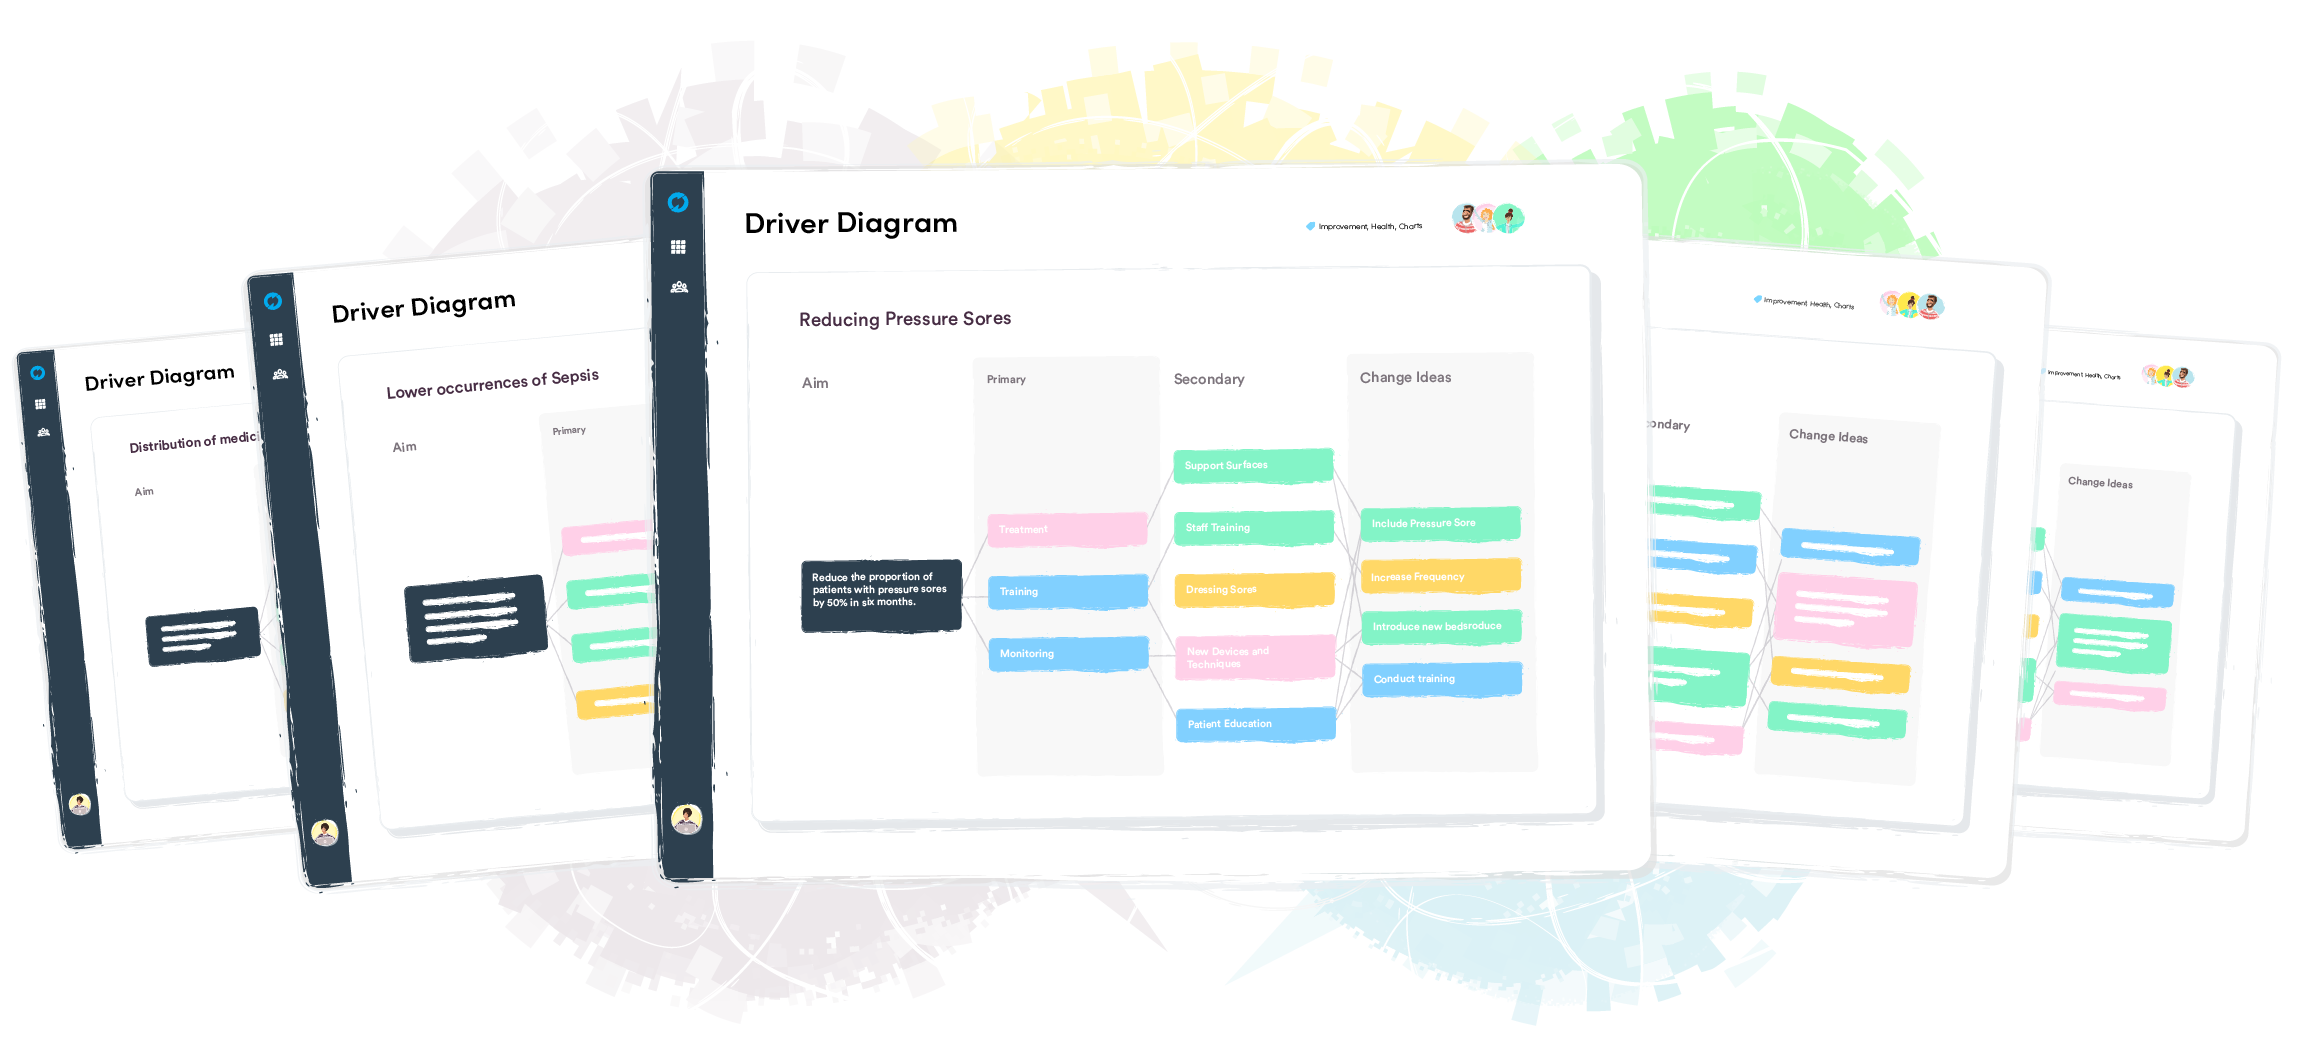
Thousands of organisations build their Driver Diagrams in Life QI


Build Driver Diagrams
Visualise your theory for improving the quality of care. Take your project’s aim and identify the contributing factors and changes that will influence realising that aim. Build your driver diagram to communicate your theory and keep stakeholders focused on what matters most.
Drag & Drop
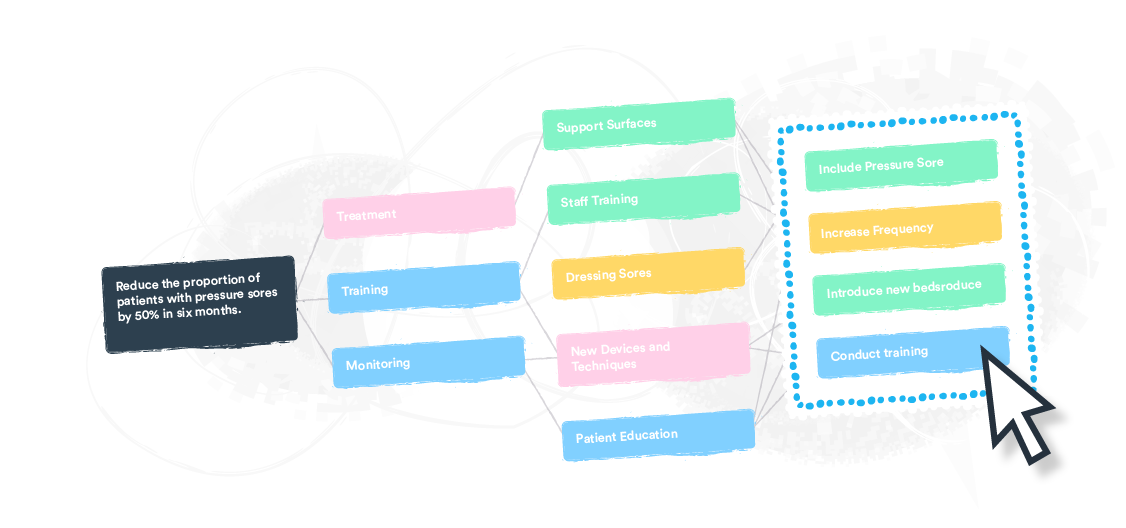
Remove the hassle of creating your driver diagram. Life QI's drag and drop interface and simple styling tools make it easy for you to build beautiful driver diagrams from scratch and create connections between your aim statement, primary and secondary drivers and change ideas.


Colour Code
Use Life QI’s colour-coding capability to categorise your drivers and change ideas. Create up to twenty-two different colour-coded categories to indicate anything that you wish. Use distinct colours to point out the status, the division, the level of importance or the person who is responsible for your drivers. You can easily add, change or remove the colour when needed.
Link change ideas to drivers
Get an overview of your whole improvement strategy by connecting the QI tools together. Link your PDSA cycles and measures to the change ideas and the change ideas to one or multiple secondary drivers easily with one click.
Export
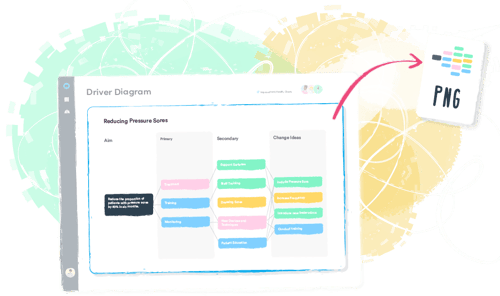
Sometimes it can be useful to export your driver diagram to facilitate discussing it during a team meeting, including it in your presentation or simply printing it. Life QI allows you to export and download your driver diagram as a PNG image file.
Choose a better way to create your Driver Diagrams
Related Improvement Tools
PDSA cycle
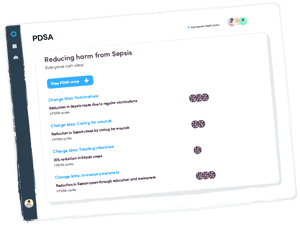
Plan and test your changes with PDSA cycles. This 'trial-and-learning' method allows you to develop a plan what change is going to be made, carry out the change, observe and learn from the consequences.
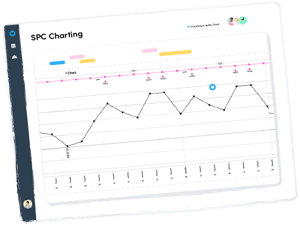
SPC Charts
Study the changes in your improvement process over time and monitor its performance. With SPC charts you can analyse process performance by plotting data points, control limits, and a centre line.

