All the QI tools your team needs to facilitate improvement

Best practice tools

Best practice tools

Bring your team together around a common toolset - the project workflow guides teams through using best practice QI tools

Empower teams

Empower teams

Equip frontline teams with easy to use tools they need to own and drive the improvement process themselves

Save time

Save time

No more searching for templates and using lots of software - with Life QI you have all your QI tools in one place

Driver Diagrams Driver Diagrams Driver Diagrams

Build Driver Diagrams

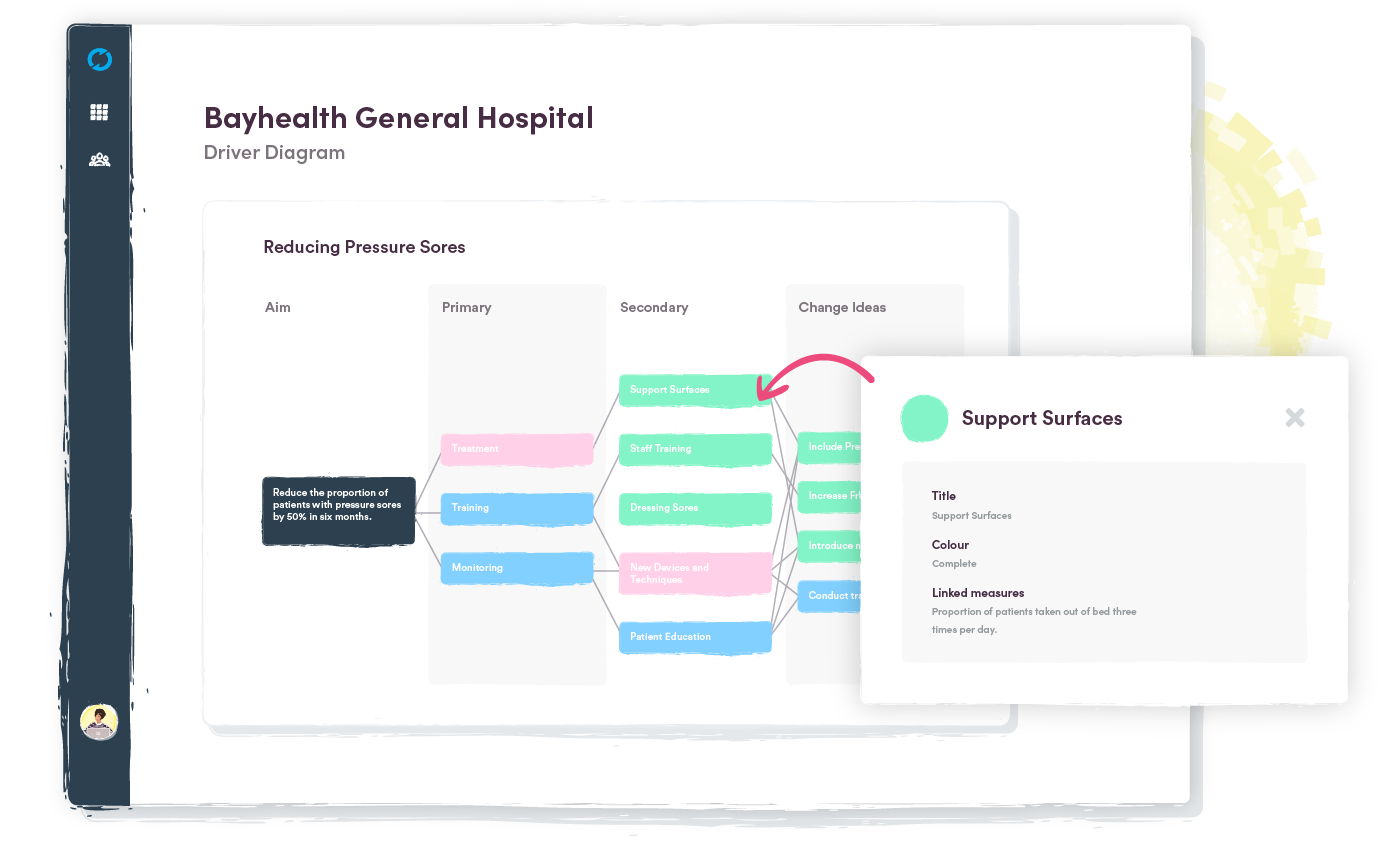
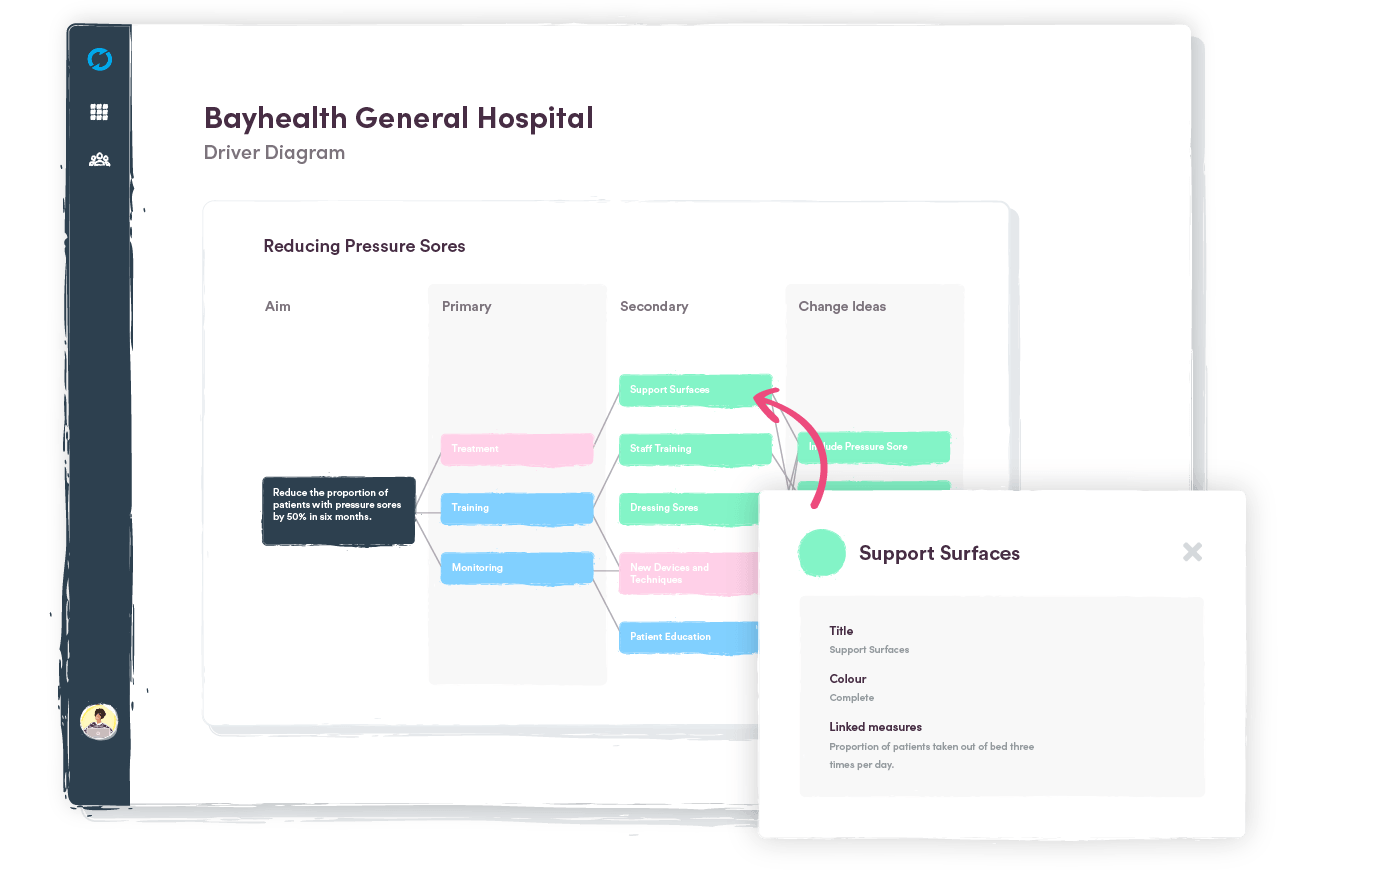
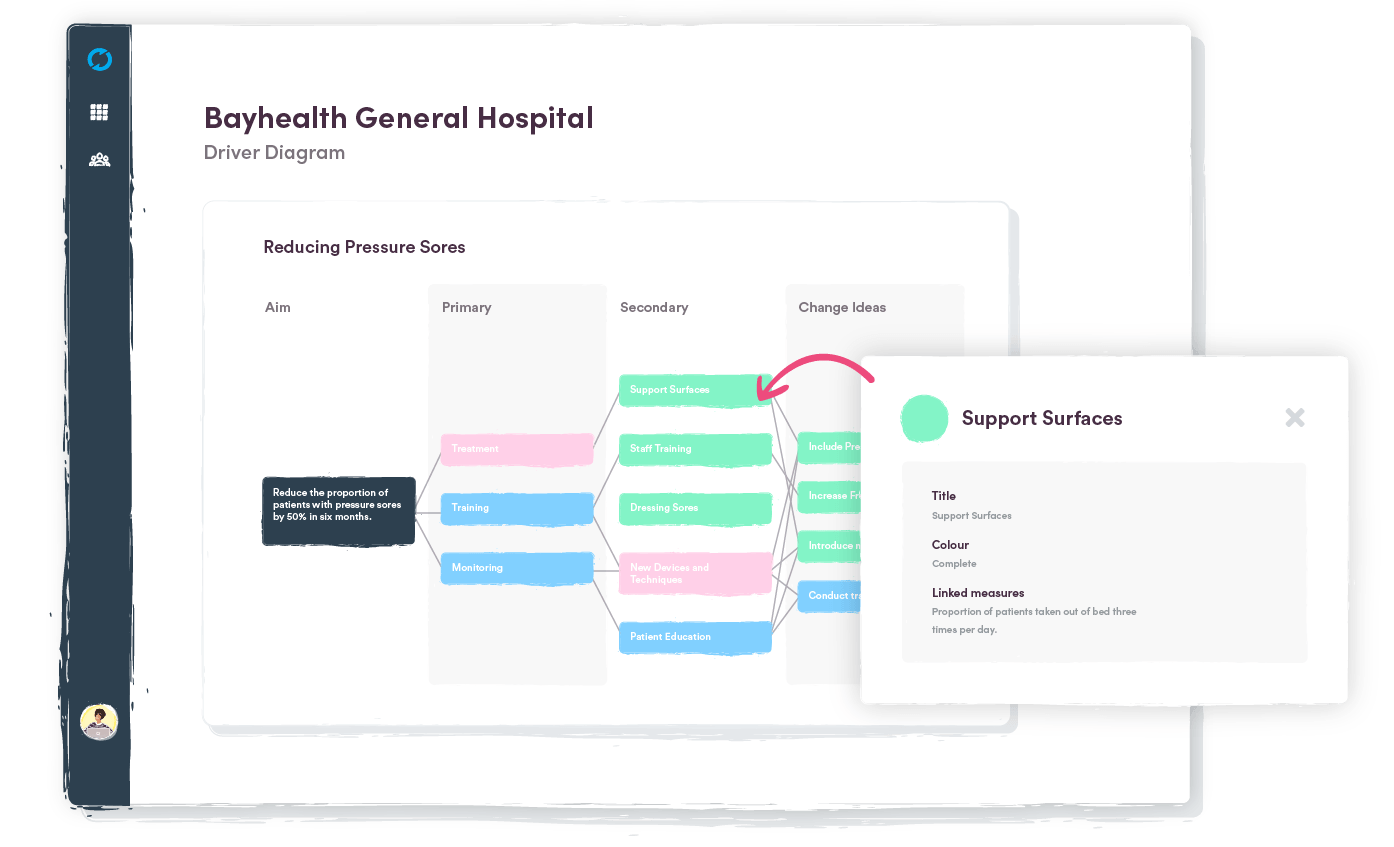
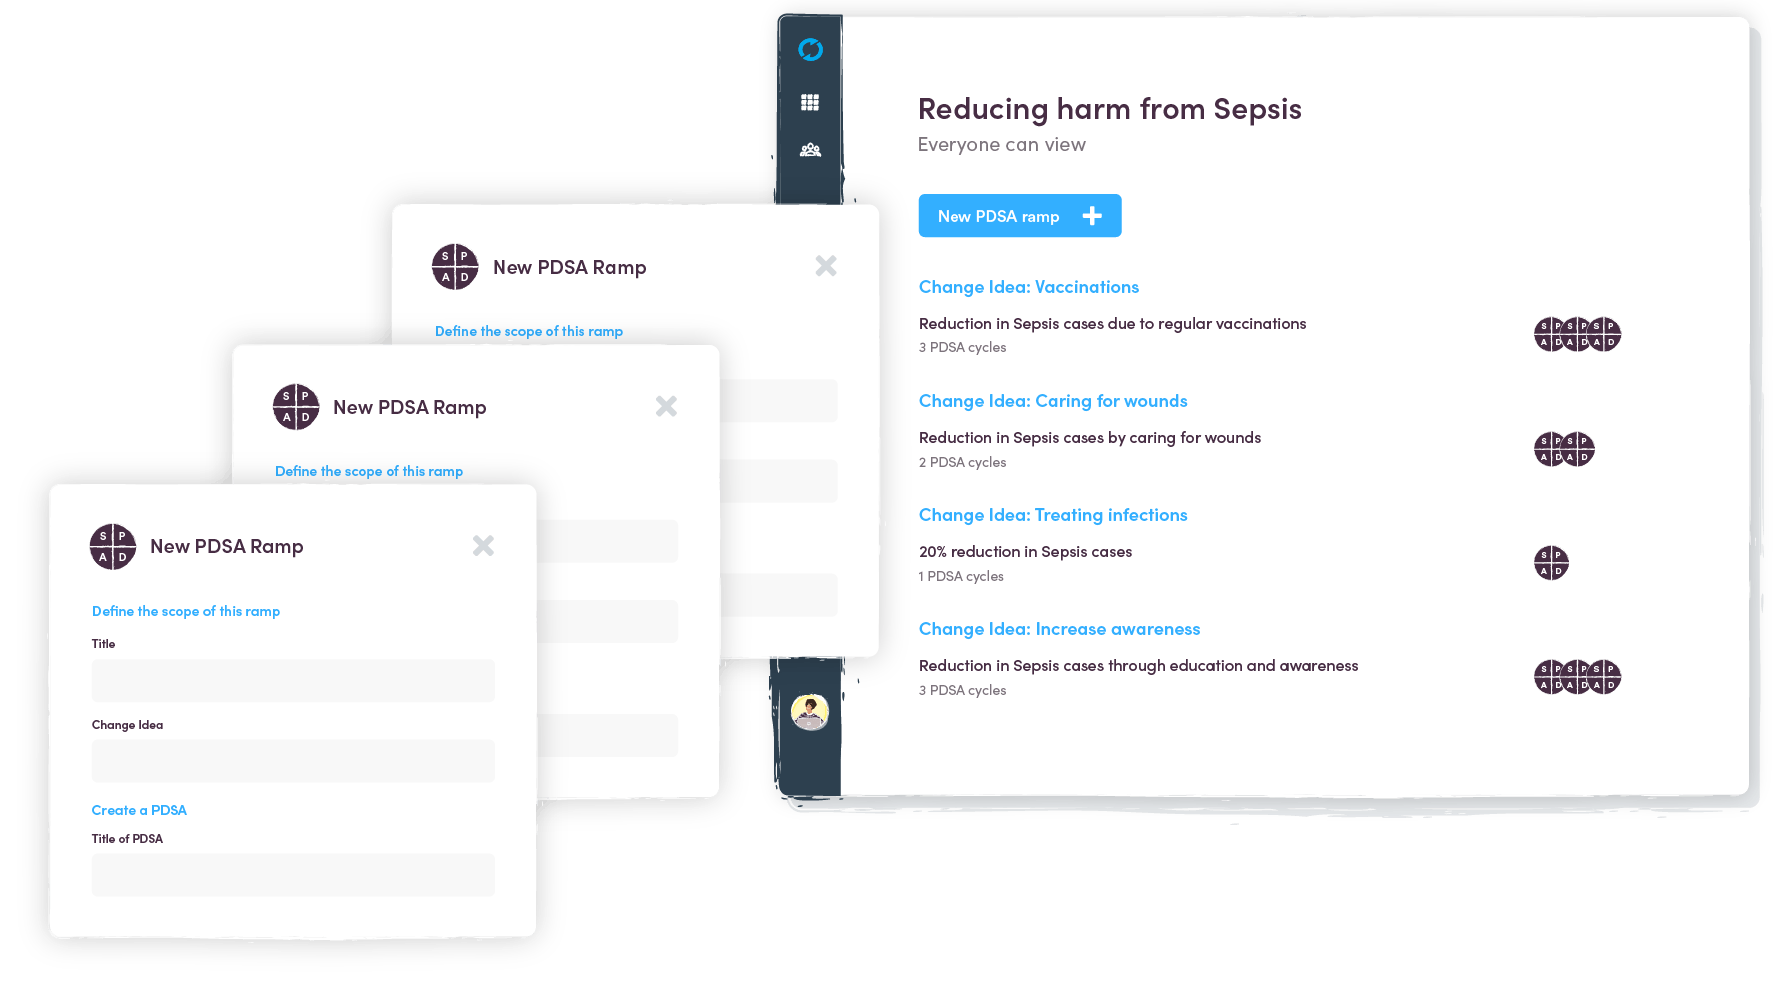
Remove the hassle and create a driver diagram with Life QI's purpose-built tool. It's fast and simple to define primary & secondary drivers, create change ideas and link to your measures.

Learn more ➔

yellow-blob
DRIVER DIAGRAMS INCLUDE
  • Drag and Drop Re-work the ordering of your drivers and change ideas any time while never having to repair links.
  • Colour Code Use colours to communicate information such as importance, progression or location.
  • Linking Your aim, drivers and change ideas are linked to the work you do throughout your project.
  • Export Download an image of your diagram in high-resolution to include in your presentations.
PDSA cycles PDSA cycles PDSA cycles

Run and Ramp PDSA Cycles

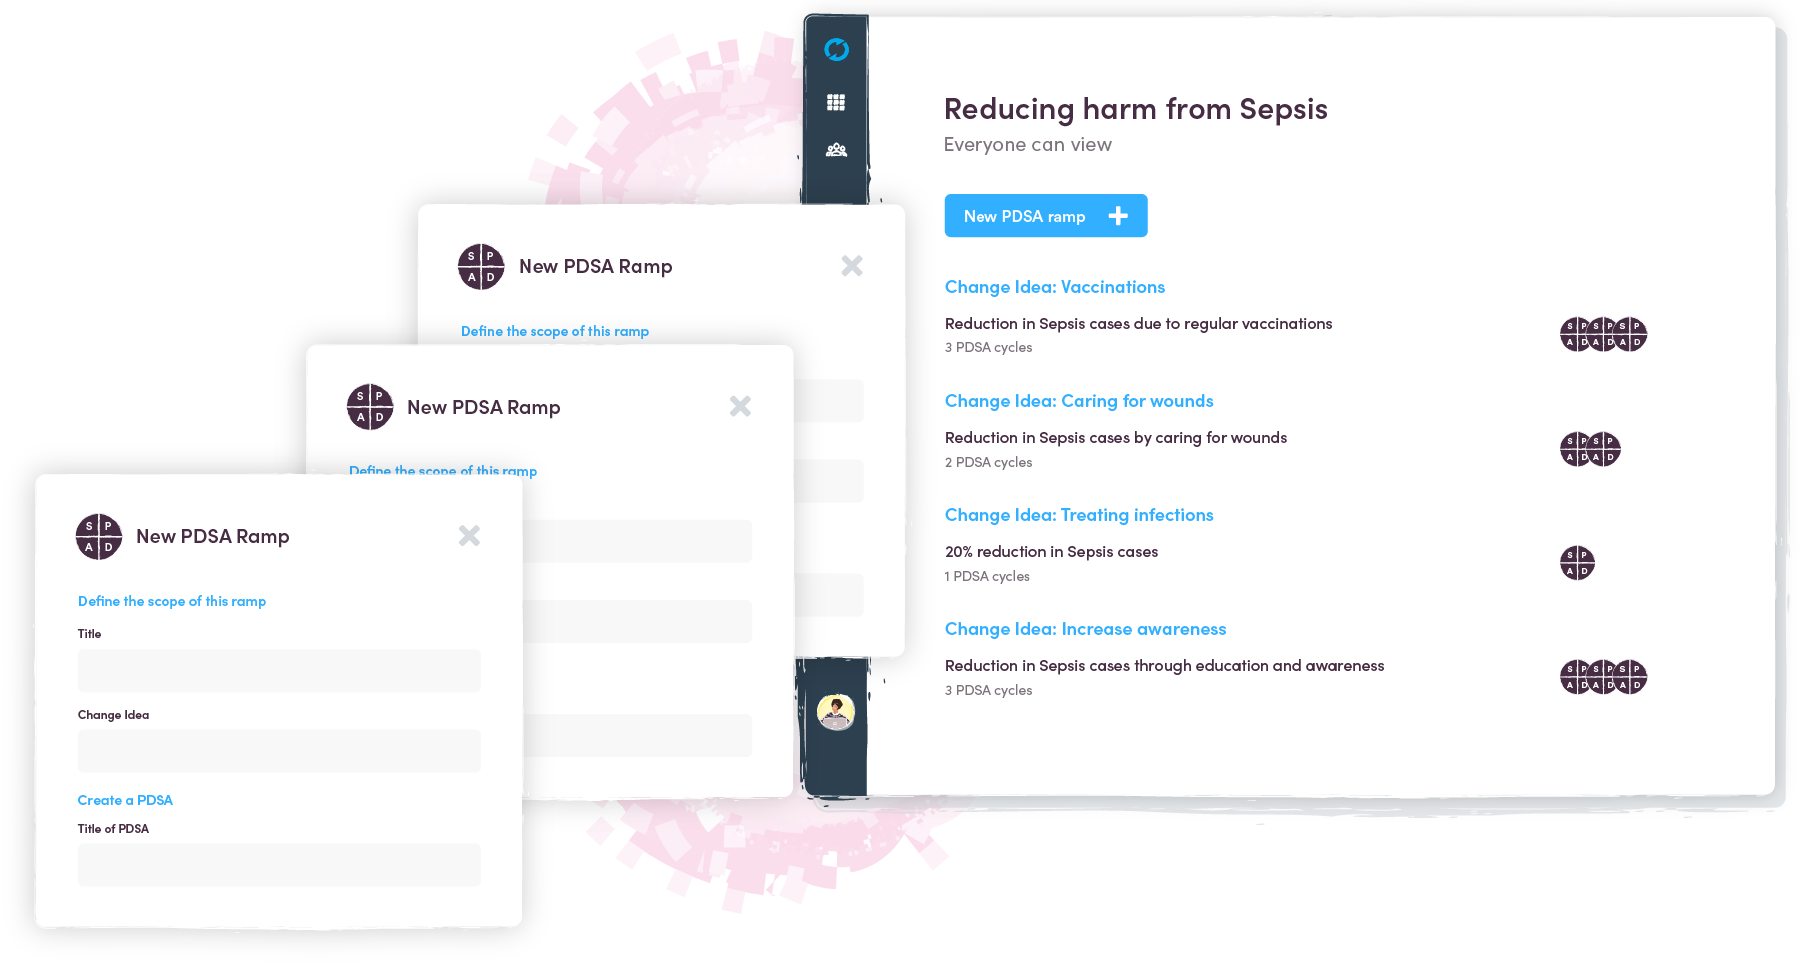
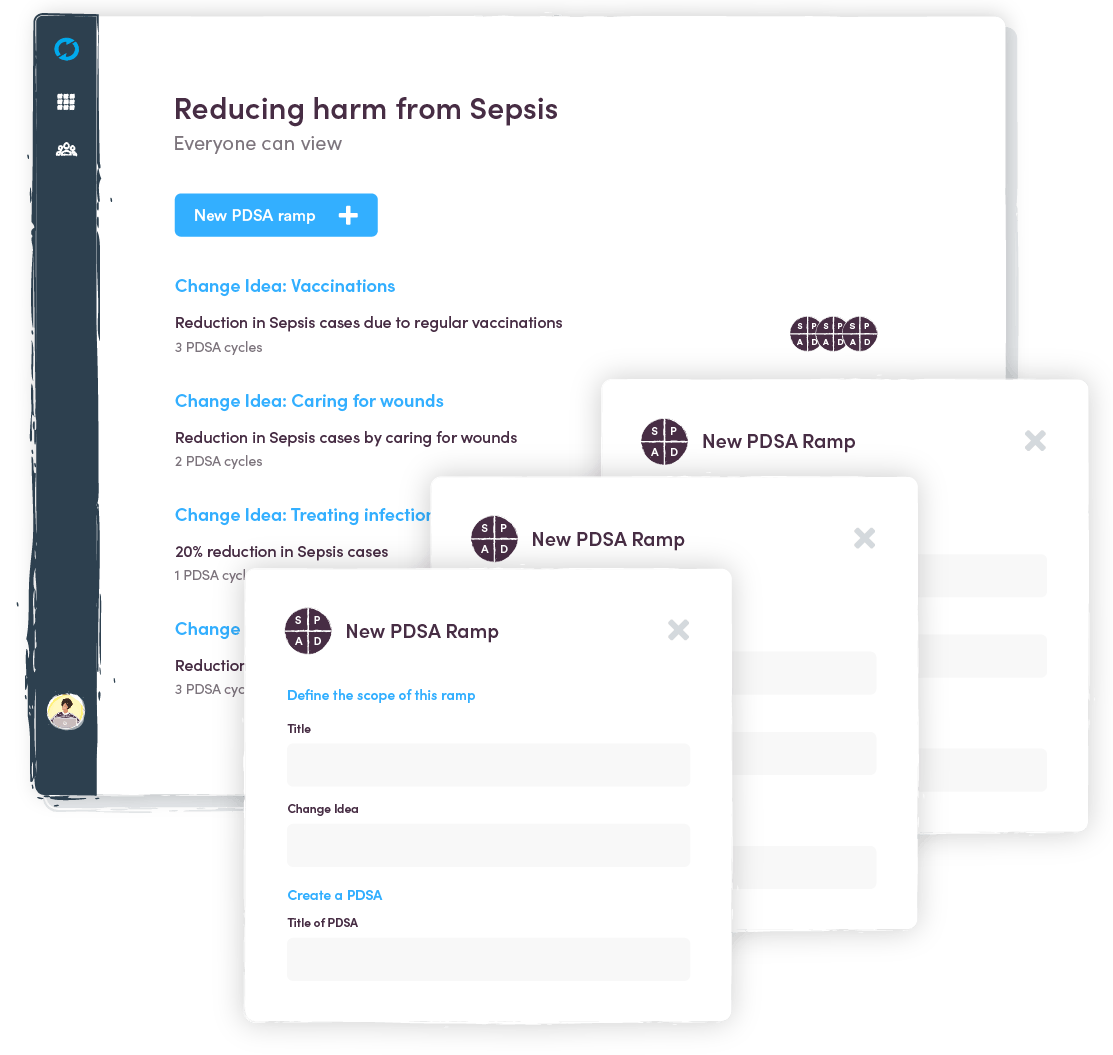
Define your plan, try it, measure it, modify it and repeat it until you get it right.

We've taken all the features of PDSA you would expect and added some new ones to deliver comprehensive tools to enable your change.

Learn more ➔

yellow-blob
CHANGE IDEAS AND PDSA CYCLES INCLUDE
  • Create and Assign Tasks Add tasks to set-up your test of change, assign the relevant people and include deadlines.
  • Link Measures Determine if your prediction succeeds by linking relevant measures to your PDSA Cycle.
  • Plot on Charts Plot PDSA cycles on your SPC charts to reveal both positive and negative outcomes of your efforts.
  • Quick Iterations Instantly duplicate and fine-tune a cycle to get straight back into your next test of change.
Artboard 25@2x SPC Charts SPC Charts

Evidence with SPC

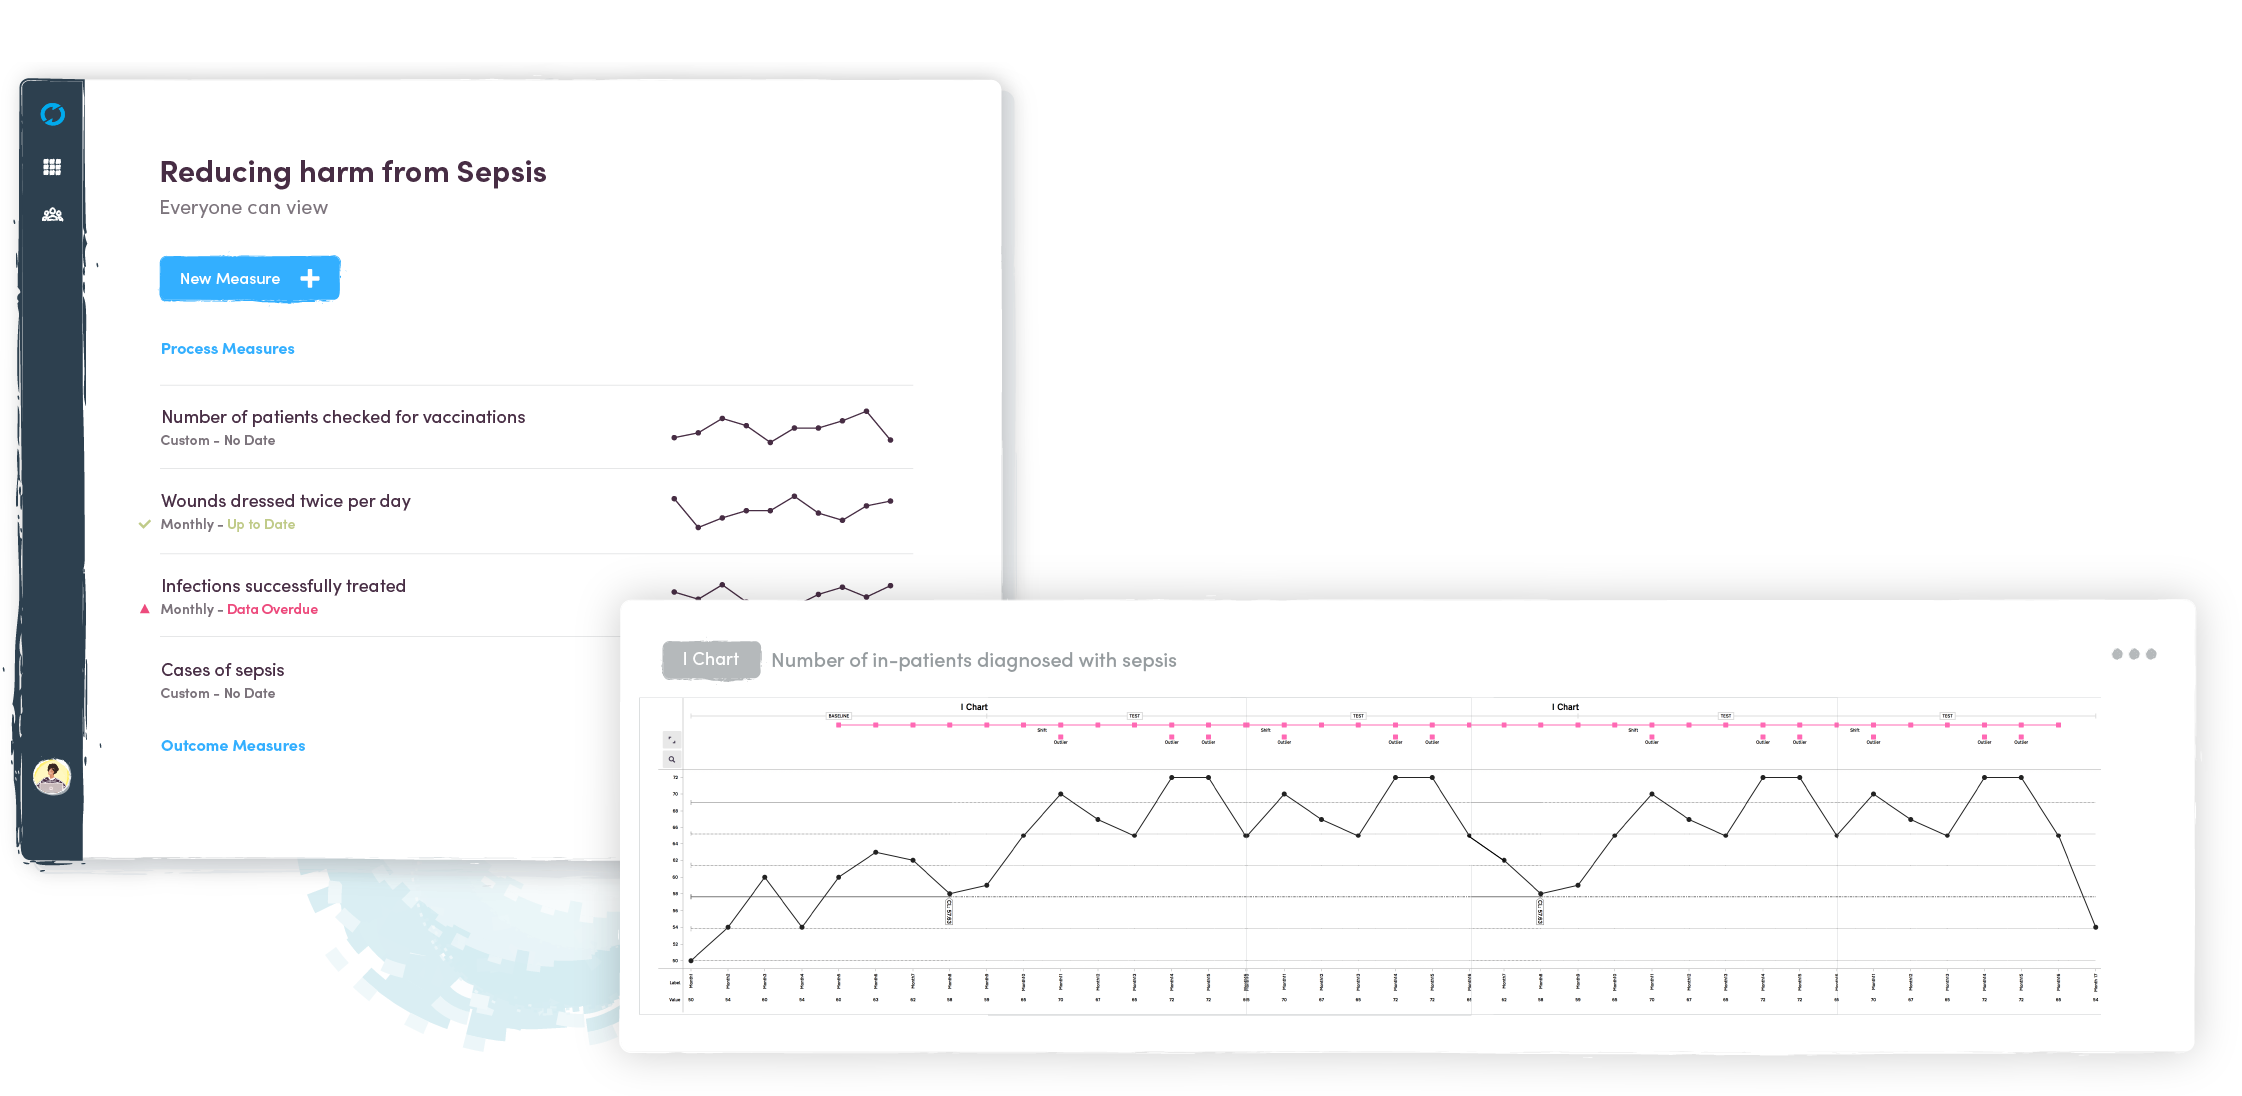
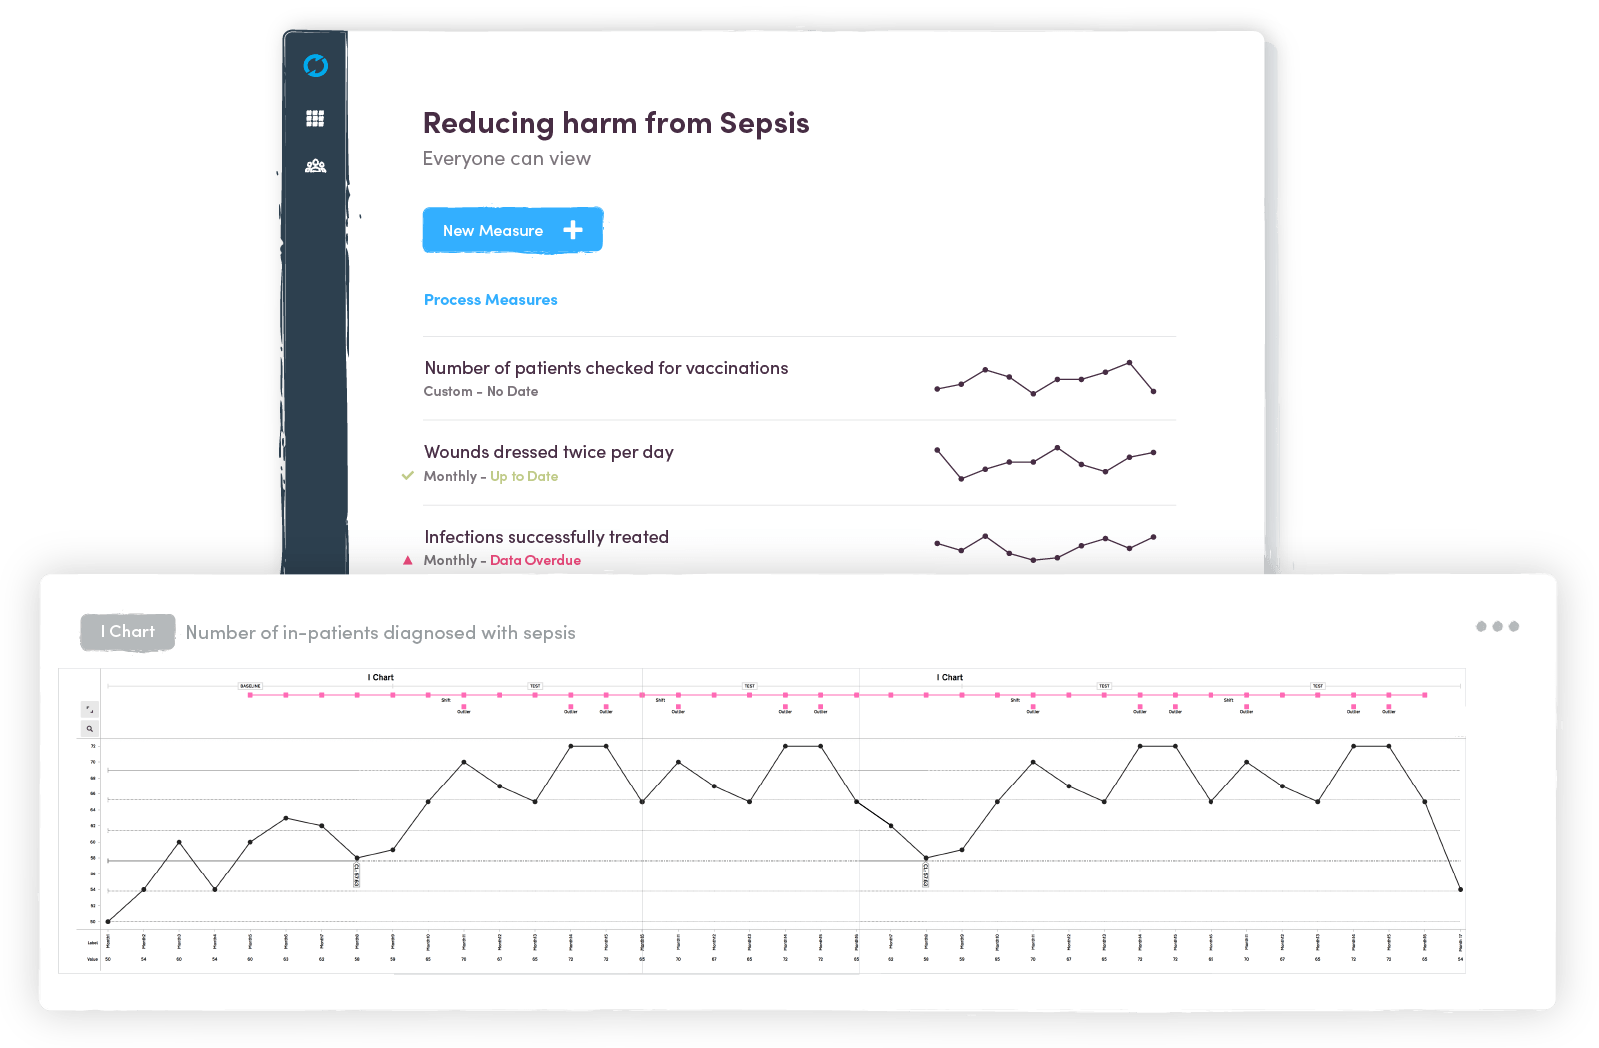
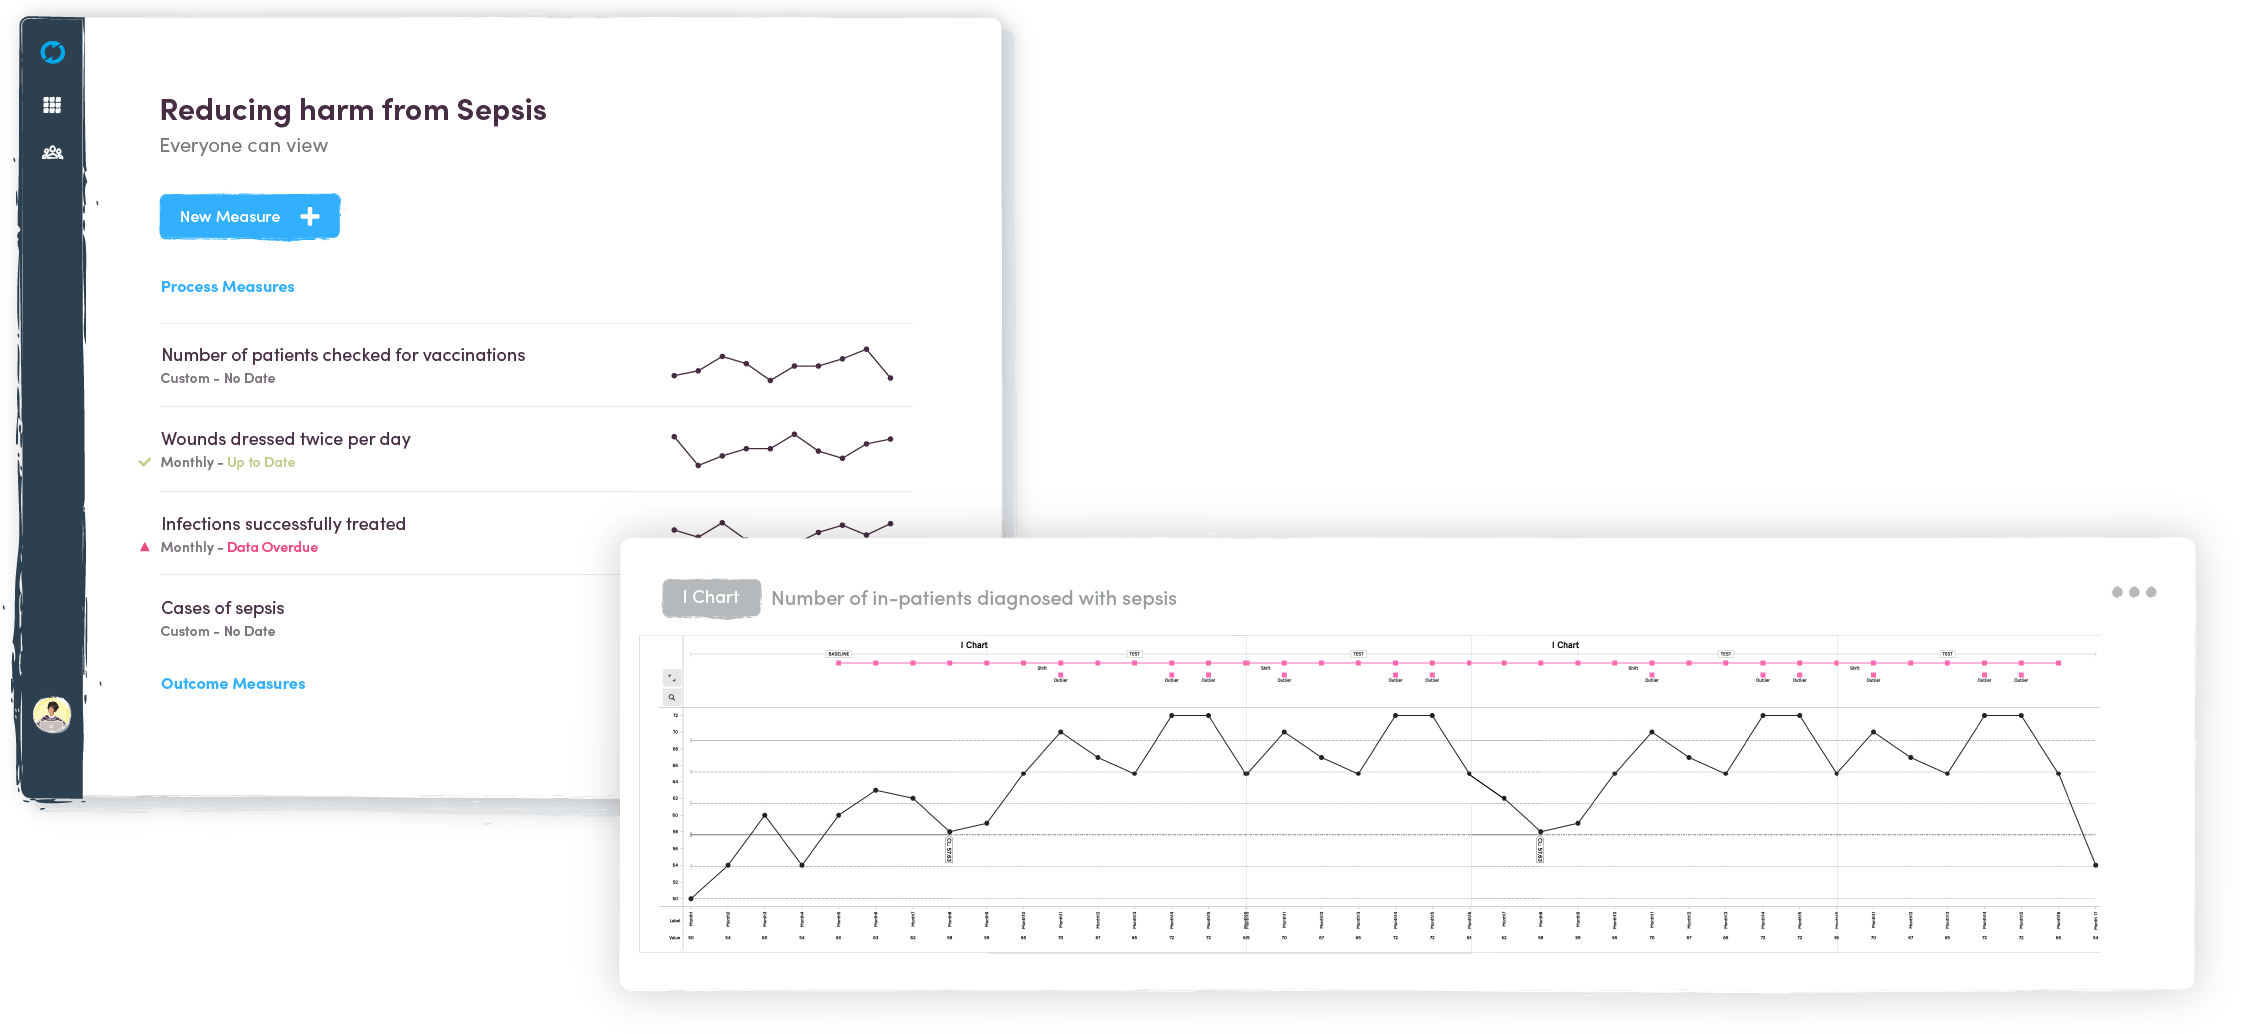
One of the staples of improvement science, SPC is a must for any improvement work.

Control charts and Run charts in Life QI take care of the heavy lifting. Just enter your data points and the chart will do the rest.

Learn more ➔

yellow-blob
MEASURES AND SPC CHARTS INCLUDE
  • Aggregation Collect data from multiple sources and it will be automatically aggregated for you.
  • Auto-Calculate and Detect Life QI calculates control limits and identifies special cause variation automatically.
  • Link Key Events Relevant PDSA cycles and notes can be revealed by linking to any data points in your chart.
  • Export Export your data to CSV or download high resolution images to use outside of Life QI
Forid Alom
The Life QI platform is a MUST for anyone running quality improvement projects. It's easy to use, intuitive and accessible from any device connected to the internet. Most importantly, the QI charting functionality is one of the best out there!
Forid Alom

Head of Analytics, East London NHS Foundation Trust

Engage, save and succeed with integrated QI tools

Foster team engagement

A consistent and integrated toolset results in higher tool usage and broader team engagement than when providing teams with standalone templates.

Save time on project admin

Upload data faster and analyse it more easily, no need to email, upload or find files, everything is automatically shared with the whole team.

Deliver more successful projects

Complete projects quicker with greater success rates thanks to easy to use best practice tools and access to learn from all projects in your organisation.

QI tools to get you from aim to evidence fast

Integrated features remove the need for additional software, moving you through your QI journey faster.

Make a Change

Define your change ideas and use Life QI to plan, share and discuss with your team. Test the ideas and learn from the outcomes.

Measure Everything

From a one-off test of change in a small organization to a 3 year long collaborative with 200 sites, Life QI can measure your entire journey.

Analyze Your Data

Automated calculation of control limits and identification of special cause variation get you to the insights you need.

Aggregate Your Sources

Measuring the same change across multiple locations? Life QI aggregates your sources automatically and in real-time to give you the full picture.

Present Your Findings

With Life QI you get simple downloads for images of your diagrams and charts to include in posters and presentations.

The Power of Sharing

Your experiences can help others across the world make the right change sooner, making what feels like the impossible, possible.

Ready to accelerate your improvement?